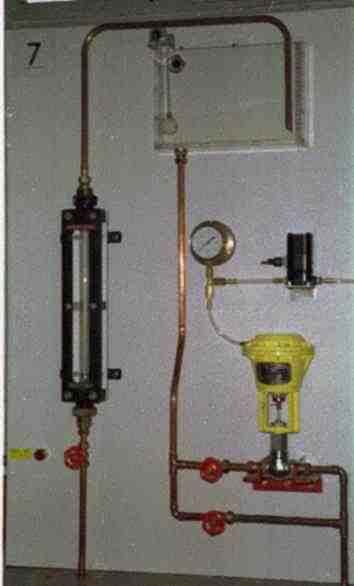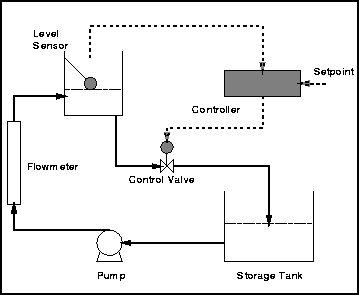
Flowsheet

The aims of this experiment are
Theory
There are two parts to this theory section


The level is controlled via a feed-back control loop. Its main feature is to directly measure the value of the controlled variable, in this case the level, and feed the signal back to the controller. The controller will compare the measured value to the setpoint. When an error is detected, the controller will take action to adjust the manipulated variable to eliminate the existing errors.
It is possible to run the experiment with or without control.
When using control, the flow in, setpoint or both can be altered. Control strategies available are On/Off, Proportional only, or Proportional and Integral control. Therefore different control parameters are required for different strategies.
When runnning without control, the flow in, valve position or both can be altered. In this case, it is the open loop response of the system which is given.
At the start of each experiment it is assumed that the level is constant at 50% and the flow in equals the flow out which is 5. Then the desired changes are made to the setpoint, flowin and/or valve position which are then kept constant for the rest of the time. It is important to actually disturb the flow by changing at least one of the above parameters, otherwise the results shown will just be the process "noise" at the original setpoint.
The input interface is simple to use. Click on the button beside the value you wish to change and drag the cursor to the new value. The computer will then take these values, run a program and produce the results. These come in the form of a single graph showing
It is possible to run the experiment any number of times. You should now try running the experiment as guided by the pre-experimental questions
Go To Pre-Experiment Questions