This clearly applies to a process where the input is an adjustment, e.g. a control valve, and the output is a measurement which might be used for control. However we can also obtain Bode diagram data for a controller , whose input is the point normally connected to the measurement from a process, and whose output is a signal to a control valve.
Consider what happens when we connect a process measurement to a controller, but do not connect the controller output to the control valve. This situation, illustrated below, is reffered to as having the control loop (process + controller) in an open loop state.

We can have a Process Bode diagram which gives the relationship between the input adjustment u and the output measurement y of the process.
We can also consider the System Open Loop Bode Diagram which relates the unconnected valve signal v which is the system output, to the actual valve position u which is the input.
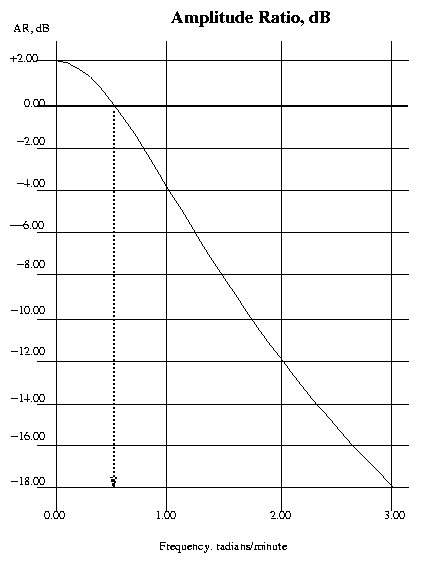
Suppose that the AR versus frequency plot for the process is as shown below.

Consider the situation if we add a proportional only controller which has a gain of one, i.e. 0dB. The measurement y undergoes the following to produce the following:
However the Phase Angle (PA) plot of the open loop system will be different from that of the process alone, because changing the sign of the measurement to turn it into the error e corresponds to changing its phase by 180 degrees, because:
sin (180 - x) = - sin (x)
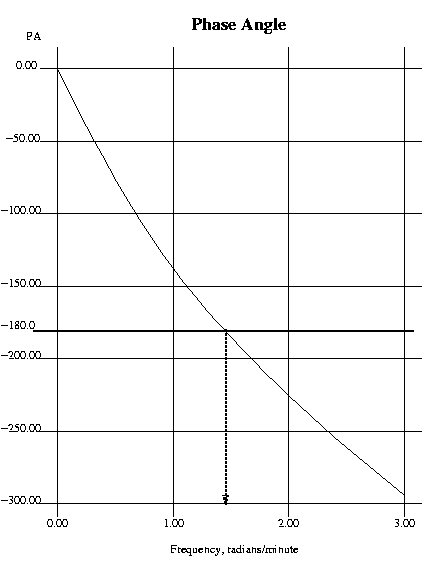
Suppose the PA plot for the process alone is as shown below.

Note that a phase angle of -180 degrees occurs at a frequency of approximately 1.4 radians/minute. This means that a sine wave of that frequency applied as u will appear as y with its phase shifted by 180 degrees. However in the open loop system the subtraction will make a further 180 degree phase change, so the valve signal v will be 360 degrees phase shifted, i.e. back `in phase' with itself.
The frequency at which 180 degrees PA occurs for a process (and so 360 or 0 degrees for the open loop process + controller) is called the Critical Frequency for the process.
Note from the AR plot that y, and v , will be of smaller amplitude than the input, by about -8dB (a factor of about 1/2.51). If the controller has unity gain, v will also be smaller by the same factor. However, suppose that the controller gain is made +8dB or 2.51; this will raise the AR of the open loop system to unity at the critical frequency. In this case a sine wave of the critical frequency would emerge from the open loop system with exactly the same amplitude and phase as it entered.
Consider what would happen if the system were in this state and the controller output v were connected up to the valve as u, i.e. the control loop were to be closed. The sine wave would continue to pass around the loop, completely unchanged, and so the system would oscillate continuously at the critical frequency.
In fact, for this to happen it is not necessary to deliberately introduce a sine wave. there is always random noise in a process, which mathematical analysis can show to be made up of essentially an infinite spread of sine wave components. In practice connecting the controller up with its gain set to 2.51 would result in the process, after an initial period during which oscllations built up steadily, reaching a state of continuous oscillation at the critical frequency. This in fact is the basis of the open loop tuning methods described earlier.
The Critical frequency, wc or fc, or critical period Pc is thus a useful property of a process which can be determined from a Bode diagram, or experimentally by gradually icreasing the gain of a proportional controller until the process oscillates steadily.
The AR of the process alone at the critical frequency allows us to determine the gain which can be applied to a proportional controller will result in steady oscillation. This is called the Gain Margin (GM) for the process and is easily calculated as minus the AR in dB or the reciprocal of the AR in linear units.
This is the maximum gain which can be applied to a controller for the process
without the system becoming unstable. Any larger gain will cause the
sine wave which leases the system to be larger than that which entered it, and so the size of the oscillation will build up, causing a theoretically
unbounded process to reach infinity, or a real process to bang back and forwards between its limits.
This is sometimes called the
If the controller is set to half the limiting stable gain, one can visaulise each sucessive sine wave peak and trough at the critical frequency emerging at half its input amplitude. This results in a quarter amplitude decay which some believe to be the ideal behaviour for a controled process, and is why the Zeigler Nichols closed loop tuning recommends that value.
Consider a hypothetical controller which had constant unity gain at all frequencies, and introduced a selectable constant phase shift. (Such a controller is not in fact possible.) By analogy with the previous argument, if this were set to introduce a phase shift of (70-180) degrees or -110 degrees, it would make the open loop phase shift at the crossover frequency 360 degrees, again resulting in a sine wave of the crossover frequency emerging from the system exactly as it entered. If such a controller were connected up in `closed loop', then the system would oscillate steadily at the crossover frequency.
The amount of phase shift which is required to cause this situation is called the Phase Margin of the process. because pure phase shift controllers do not exist, this is not quite such a useful concept as the gain margin, but it provides a measure of the amount of additional phase shift which a process can withstand before becoming unstable, and hence, indirectly, an indication of the amount of integral action (which produces a phase shift) which can be applied to a process.
Note that many processes have less than unity gain at zero frequency, and hence do not have a crossover or phase margin. The concept is still useful as it can be applied to a process and a controller together.
Determining
For the process considered above, we can determine the following:
Some tuning procedures involve designing a controller to give the system of process plus controller particular gain and phase margins. A `rule of thumb' for tuning is that the system open loop characteristics should be:
By these criteria this example process would not be well controlled with the Zeigler Nichols settings, and a rather lower gain ought to be used.
Return to Start of Module 7: Frequency Response Techniques